Lumen Vietnam Fund

Blog

Car sales hit 126,800 in first four months of 2026

Car sales hit 126,800 in first four months of 2026

The figure representing a year-on-year increase of 25%.

Members of the Vietnam Automobile Manufacturers’ Association (VAMA) sold 126,794 vehicles in the first four months of 2026, a year-on-year increase of 25%, the association has announced.

Passenger vehicle sales rose by 18%, commercial vehicles by 38%, while special-use vehicles recorded a sharp increase of 119%.

Imported completely built-up vehicles continued to grow faster than domestically assembled models. By the end of April, sales of locally assembled vehicles had gone up 16% year-on-year while imported units soared by 32%.

In April alone, some 31,937 vehicles were sold, dropping 17% from the previous month. Of the total sales, passenger vehicles accounted for 21,284 units, down 14% month-on-month; commercial vehicles 9,805 units, a decline of 26%; and special-use vehicles 848 units.


Source: Phi Hùng

Photo: Photo for illustration

Latest Posts

Vietnam auto market sees strong supply growth as domestic production surges

Vietnam auto market sees strong supply growth as domestic production surges

In the first five months of the year, domestic manufacturers produced an estimated 232,100 vehicles, up 26.7% year-on-year.

The number of new vehicles entering Vietnam’s automotive market rose sharply in May 2026, driven by robust growth in domestic production, which continued to outpace imports.

According to the National Statistics Office under the Ministry of Finance, an estimated 76,837 new vehicles, including both locally assembled and imported models, were supplied to the market in May, up 13.2% from April's total of 67,880 units.

Domestic automakers produced an estimated 53,700 vehicles during the month, an increase of 4.7% from April and 40% higher than the same period last year. The figure marked the highest monthly production level recorded so far in 2026, surpassing the previous peak of 51,700 units in January.

In the first five months of the year, domestic manufacturers produced an estimated 232,100 vehicles, up 26.7% year-on-year.

Vehicle imports also recorded strong growth. Vietnam imported an estimated 23,137 completely built-up (CBU) vehicles in May, with a total value of $548 million. Compared with April, imports increased 39.5% in volume and 26.5% in value.

While import volumes were broadly unchanged from May 2025, the value of imported vehicles rose 29.2%, suggesting a shift toward higher-priced models and premium vehicle segments.

During the first five months of 2026, Vietnam imported approximately 95,427 CBU vehicles worth $2.3 billion. The figures represented a modest increase of about 10% in volume and a substantial 26.7% rise in value compared with the same period last year, reflecting continued demand for imported vehicles and higher-value automotive products.


Vietnam Manufacturing PMI

Vietnam Manufacturing PMI

Summary

The S&P Global Vietnam Manufacturing PMI jumped to 52.8 in May 2026, picking up from a seven-month low of 50.5 in the previous month. It marked the highest reading since February, mainly due to a renewed increase in new orders, which expanded at the fastest pace in three months as customers built precautionary inventories amid concerns over a prolonged conflict in the Middle East. The recovery in demand was accompanied by a thirteenth consecutive month of output growth, with production expanding at the quickest pace since February. Meanwhile, input cost inflation quickened to its highest level since April 2011, driven mainly by higher fuel, oil, and transportation expenses. In response, output price inflation was among the strongest seen in the past fifteen years, although the pace of increase eased slightly from April. Looking ahead, business confidence remained relatively subdued, as firms remained wary of the potential long-term repercussions of the conflict in the Middle East.

Vietnam Manufacturing PMI

The S&P Global Vietnam Manufacturing Purchasing Managers’ Index measures the performance of the manufacturing sector and is derived from a survey of 400 manufacturing companies. The Index is based on five individual indexes with the following weights: New Orders (30 percent), Output (25 percent), Employment (20 percent), Suppliers’ Delivery Times (15 percent) and Stock of Items Purchased (10 percent), with the Delivery Times index inverted so that it moves in a comparable direction. A reading above 50 indicates an expansion of the manufacturing sector compared to the previous month; below 50 represents a contraction; while 50 indicates no change. This is only a limited sample of PMI headline data displayed on the Customer’s service, under licence from S&P Global. Full historic PMI headline data and all other PMI sub-index data and histories are available on subscription from S&P Global. Contact economics@spglobal.com for more details.

Vietnam’s industrial production records strongest five-month growth in four years

Vietnam’s industrial production records strongest five-month growth in four years

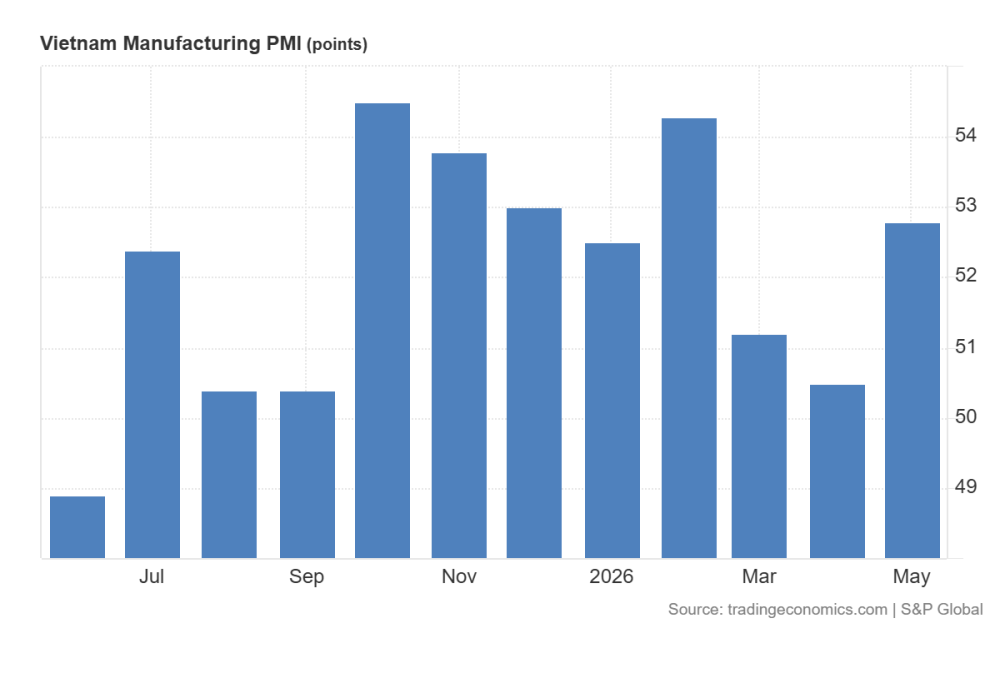
Vietnam’s industrial production maintained strong momentum in the first five months of 2026, with the Index of Industrial Production (IIP) rising 9.1% year-on-year, the highest growth rate for the period in the past four years, according to the Ministry of Finance’s National Statistics Office (NSO).

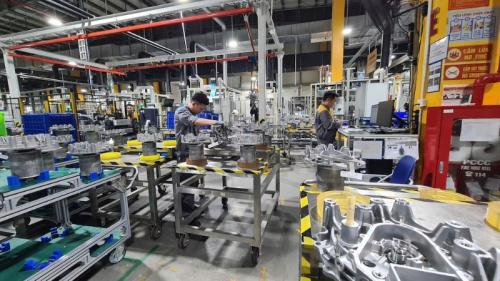
The office reported that the IIP expanded across all 34 provinces and cities during the period. Strong growth in manufacturing and processing, along with electricity production and distribution, drove industrial expansion in many localities, while some areas recorded slower growth due to weaker performance in manufacturing, mining and power generation.

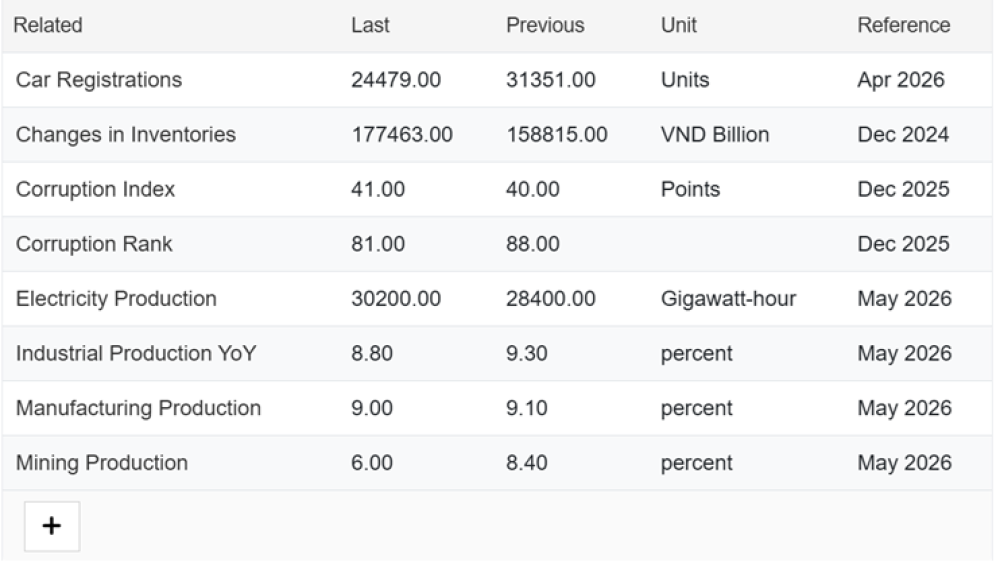
​In May alone, the IIP was estimated to increase 3.3% from the previous month and 8.8% year-on-year. Manufacturing and processing grew 9% compared to the same period last year, while water supply, waste and wastewater management activities rose 8.7%, electricity production and distribution increased 8.5%, and mining expanded 6%.

​Overall, in the January–May, IIP growth of 9.1% surpassed the 8.8% increase recorded in the same period of 2025. Manufacturing and processing, the key driver of industrial growth, expanded 9.5%, contributing 7.4 percentage points to the overall increase. Mining rose 5.5%, reversing a decline in the corresponding period last year, while electricity production and distribution grew 7.6%.

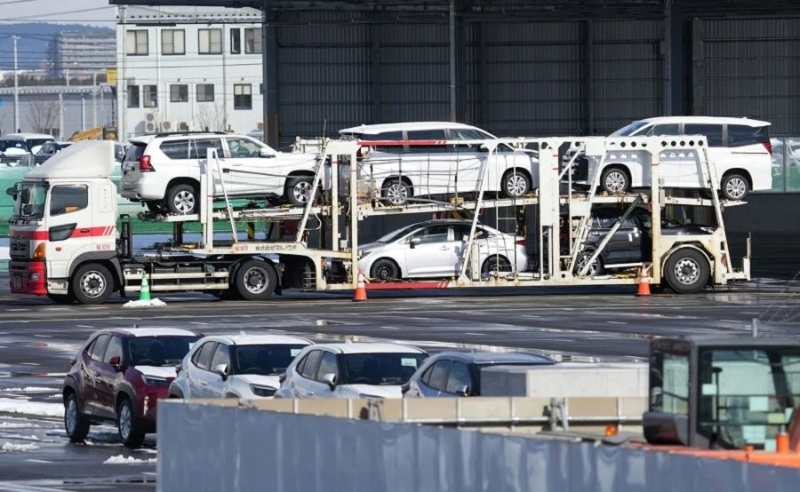
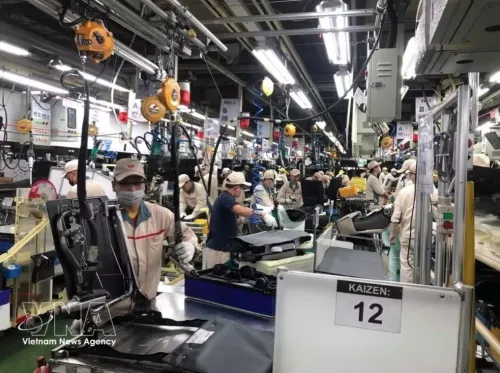
​Several major industries posted robust growth, including metal production (20.2%), motor vehicle manufacturing (18%), chemicals and chemical products (16.9%), other non-metallic mineral products (16.2%), and beverages (15.1%). In contrast, the production of hard coal and lignite mining declined 4.6%, while that of other transport equipment fell 1%.

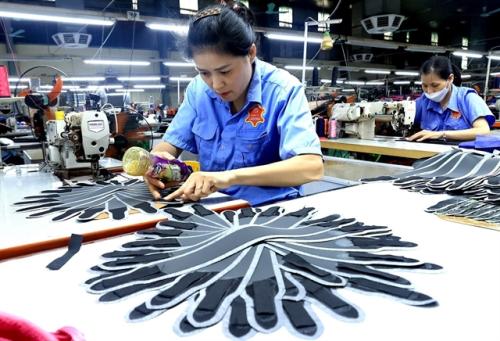
Among key industrial products, motorcycle output surged 36% year-on-year, followed by automobiles (26.7%), processed seafood products (21.6%), rolled steel (21.5%), and sugar and beer, both up 14.4%. Meanwhile, production of NPK fertiliser fell 6.8%, MSG declined 6%, leather footwear dropped 5.7%, and clean coal production decreased 4.7%.

The labour market also showed positive signs. As of May 1, the number of employees working in industrial enterprises increased 1.1% from a month earlier and 3.4% year-on-year, the NSO said. Employment in foreign-invested enterprises rose 1.5% month-on-month and 3.4% year-on-year, while non-State enterprises recorded corresponding increases of 0.6% and 2.6%.

​The broad-based growth of industrial production underscores the resilience of the sector and its role as a key driver of economic expansion, although continued efforts are needed to improve productivity, strengthen manufacturing and ensure sustainable growth.


See all blog