Lumen Vietnam Fund

Blog

FDI tops US$50 billion in nine months, disbursement hits five-year high

FDI tops US$50 billion in nine months, disbursement hits five-year high

Registered foreign investment in Vietnam surged in the first nine months of 2026, while disbursed FDI also maintained strong momentum, reaching its highest nine-month level in five years, according to the Foreign Investment Agency under the Ministry of Finance.

Registered foreign investment in Vietnam reached US$50.36 billion in the first nine months of 2026, up 76.4% year on year, while disbursed FDI was estimated at US$21.07 billion, its highest nine-month level in five years, according to the Foreign Investment Agency under the Ministry of Finance.

Manufacturing remains the main FDI destination

Manufacturing and processing continued to attract the largest share of foreign investment, reflecting the sector’s dominant role in Vietnam’s FDI landscape.

Newly registered projects accounted for US$29.24 billion of total registered capital during the January-September period. Existing projects added US$14.15 billion through 948 capital adjustments, while foreign investors contributed US$6.97 billion through capital contributions and share purchases.

Vietnam licensed 3,108 new foreign-invested projects, up 6.2% in number from a year earlier, while their registered capital more than doubled to US$29.24 billion.

Manufacturing and processing accounted for US$13.38 billion, or 45.8% of newly registered capital, followed by transport and storage with US$5.14 billion, or 17.6%.

When newly registered and additional capital are combined, manufacturing and processing attracted US$21.82 billion, representing 50.3% of the total. Real estate businesses received US$6.94 billion, or 16%.

Foreign investors also made 2,335 capital contributions and share purchases worth US$6.97 billion, up 44% year on year. Of these, 725 transactions increased companies’ charter capital, while 1,610 involved purchases of domestic shares without increasing charter capital.

Professional, scientific and technical activities attracted US$2.75 billion through these transactions, followed by wholesale and retail trade and vehicle repair with US$2.02 billion.

Singapore leads investment sources

Singapore was the largest source of registered FDI in Vietnam, with US$12.85 billion, followed by the Republic of Korea with US$9.75 billion and Hong Kong with US$5.41 billion.

Ho Chi Minh City led Vietnam’s provinces and cities in registered foreign investment with US$18.23 billion, followed by Thai Nguyen with US$8 billion, Bac Ninh with US$4.27 billion and Hanoi with US$4.13 billion.

The increase in registered investment was accompanied by continued growth in actual capital disbursement. Disbursed FDI was estimated at US$21.07 billion in the first nine months, up 12.1% year on year and the highest level for the period in five years.

Manufacturing and processing accounted for US$17.4 billion, or 82.6% of total disbursed FDI. Real estate attracted US$1.59 billion, while electricity, gas, hot water, steam and air-conditioning production and distribution received US$723.4 million.

The Foreign Investment Agency said the strong inflow came despite a recent slowdown in global investment flows amid geopolitical uncertainty and US tariff policies, indicating continued foreign investor confidence in Vietnam.

The rise in disbursed FDI is expected to strengthen production capacity and support economic growth.


Source: VOV

Latest Posts

Vietnam’s inflationary pressures intensify

Vietnam’s inflationary pressures intensify

Inflationary pressures in Vietnam are mounting as the consumer price index (CPI) in September rose 0.62% from the previous month and 5.08% from a year earlier.

For the first nine months of the year, CPI increased 4.52%, above the 3.27% rise recorded in the same period last year and slightly exceeding the government’s target of controlling inflation at around 4.5% for this year.

This was the highest nine-month average CPI rise recorded during the 2016-2026 period, according to the National Statistics Office (NSO).

At a press meeting on Saturday, NSO director Nguyen Thi Huong stressed that pressures from input costs, energy price fluctuations and inflation risks remained, posing challenges for economic management in the period ahead.

She said fuel prices were being managed proactively and flexibly, in line with global price movements and domestic supply and demand. The supply of essential goods was broadly ensured, helping maintain market stability. However, factors putting pressure on the overall price level had yet to subside.

The structure of price hikes over the first nine months showed that inflationary pressures were not limited to a few temporary items but were also concentrated in essential goods and services that can directly affect living costs and business and production activities.

According to NSO data, prices of food and catering services rose 4.72% year-on-year, contributing 1.69 percentage points to the overall CPI increase. This was the largest contribution among the main groups of consumer goods and services.

Within this group, pork prices climbed 4.46%, poultry prices increased 3.93%, while prices of food services outside the home jumped 7.14%.

Higher input and service costs, along with increased consumer demand, were among the factors affecting price movements. Given the significant share of food and catering in household spending, price fluctuations in this group have a direct impact on how consumers perceive inflation.

The housing, electricity, water, fuel and construction materials group rose 6.68%, adding 1.52 percentage points to the overall CPI expansion. Within the group, prices of housing maintenance materials surged 13.07%, rents 4.91% and household electricity prices 4.35%.

The developments reflected pressure from both housing construction and repair costs as well as the cost of maintaining households. In particular, higher construction material prices could raise investment and construction completion costs while putting pressure on the prices of goods and services in related sectors.

In the transport group, prices rose 6.06% in the nine-month period, adding 0.6 percentage points to the overall CPI increase. Fuel prices went up 10.89% year-on-year. In September alone, transport prices rose 3.97% from the previous month, with petrol prices up 9.39% and diesel prices 4.53%, mainly due to domestic fuel price adjustments.

Energy prices have an impact beyond the transport sector. When petrol and diesel prices rise, transportation and distribution costs can also increase, putting pressure on the selling prices of many other goods. The extent of the pass-through depends on fuel price movements, logistics costs, businesses’ ability to absorb higher costs, and market purchasing power.

At the same time, input costs in the production sector also showed an upward trend. According to the NSO, in the first nine months of 2026, the producer price index for industrial products rose 4.37%, while the price index for raw materials, fuel and materials used in production climbed 5.12% year-on-year. Both were the highest increases for the same period during 2023-2026.

These indicators do not mean that all higher costs will immediately be passed on to consumer prices. However, if raw material, energy and transportation costs remain elevated, businesses may have to choose between narrowing profit margins, cutting costs or adjusting selling prices. If consumer demand remains firm, the risk of higher input costs being passed through to final goods and services will need to be closely monitored.

One notable development was that core inflation averaged 4.26% in the first nine months, below the 4.52% increase in headline CPI. In September alone, core inflation rose 0.11% from the previous month and 4.45% from a year earlier.

The gap between the two measures partly reflects the role of items with volatile prices, such as petrol, gas, food and fresh produce, and healthcare services, in headline CPI. These groups are excluded from the calculation of core inflation. Therefore, headline CPI rising faster than core inflation indicates significant pressure from specific price factors, but is not sufficient to conclude that inflationary pressures have spread evenly across all groups of goods and services.

Nevertheless, CPI movements over the past two months and rising production costs underscore the need for greater caution in price management in the fourth quarter. The target of around 4.5% is already under pressure, with average CPI for the first nine months reaching 4.52%. If prices continue to rise in the remaining months, bringing the full-year average below that threshold will become increasingly difficult.

Against this backdrop, economic management will need to balance price stability with maintaining growth momentum. Containing prices cannot rely solely on administrative measures but needs to be accompanied by ensuring supply, reducing circulation costs, improving market transparency and curbing the practice of using fluctuations in input costs to raise prices unreasonably.

From now until the end of the year, CPI movements will depend significantly on global energy prices, input costs, food supplies and the timing of adjustments to prices of essential goods and services.

With average CPI already above the target of around 4.5%, controlling inflation is not only a task for the final months of the year but also has implications for price expectations, the cost of capital and purchasing power in the economy in the following year.

Industrial production posts strongest nine-month growth since 2019

Industrial production posts strongest nine-month growth since 2019

Vietnam's Industrial Production Index (IIP) in the first nine months of 2026 is estimated to rise 12.3% year on year.

Vietnam’s industrial production maintained double-digit growth in the first nine months of 2026, with the Industrial Production Index (IIP) estimated to rise 12.3% year on year, the highest nine-month growth rate since 2019, according to the National Statistics Office.

Industrial production in the third quarter increased an estimated 14.8% from a year earlier, with manufacturing and processing growing 15.3%.

For the January-September period, manufacturing and processing remained the main driver of industrial growth, expanding 12.9%, compared with 10.3% in the same period of 2025. The sector contributed 10 percentage points to the overall IIP increase.

Electricity production and distribution rose 10.6%, accelerating from 6.3% a year earlier and contributing 0.9 percentage points to overall growth. Water supply, waste management and wastewater treatment increased 9.3%, compared with 8.6% in the same period last year, contributing 0.1 percentage point.

The latest figures indicate that Vietnam’s industrial sector has strengthened considerably in 2026, with manufacturing continuing to provide the bulk of momentum.


​

Half of localities post double-digit GRDP growth in Q3

Half of localities post double-digit GRDP growth in Q3

Leading the pack were Quang Ninh (15.04%), Thai Nguyen (13.96%), Bac Ninh (13.83%), and Hai Phong (13.09%).

Local economic performance in the third quarter of 2026 recorded robust growth across many jurisdictions, according to the National Statistics Office under the Ministry of Finance.

Among the nation's total 34 centrally-run cities and provinces, and only nine surpassed the 10% threshold in the first half of the year, and the number, however, rose to 17 in Q3 2026.

Leading the pack were Quang Ninh (15.04%), Thai Nguyen (13.96%), Bac Ninh (13.83%), and Hai Phong (13.09%). They were followed by Hung Yen (12.01%), Ha Tinh (11.84%), Da Nang (11.83%), Dien Bien (11.67%), Khanh Hoa (10.66%), Lao Cai (10.58%), Ninh Binh (10.54%), Thanh Hoa (10.49%), An Giang (10.28%), Tay Ninh (10.24%), Dong Nai (10.21%), Nghe An (10.11%), and Hanoi (10.02%).

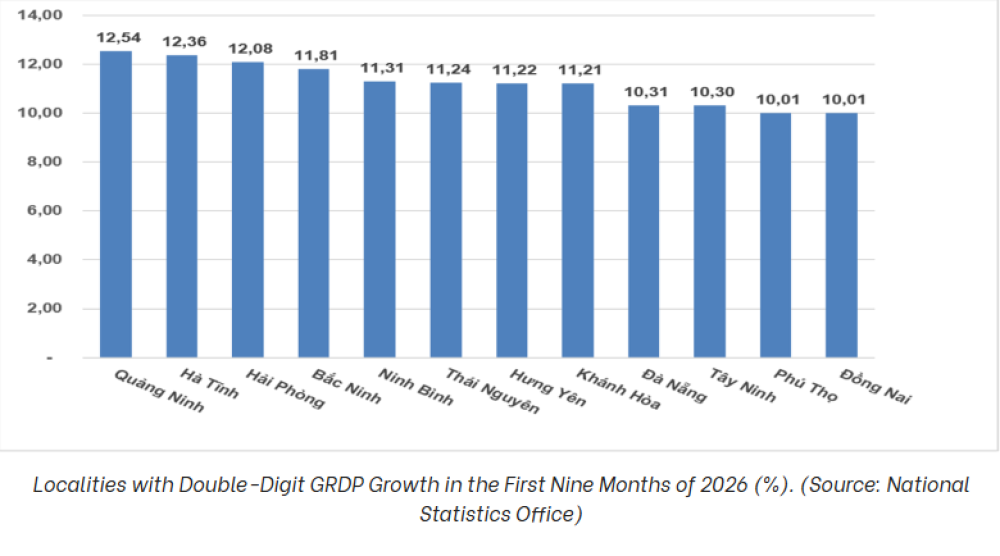
For the first nine months combined, 12 localities achieved cumulative growth above 10%: Quang Ninh (12.54%), Ha Tinh (12.36%), Hai Phong (12.08%), Bac Ninh (11.81%), Ninh Binh (11.31%), Thai Nguyen (11.24%), Hung Yen (11.22%), Khanh Hoa (11.21%), Da Nang (10.31%), Tay Ninh (10.30%), Phu Tho (10.01%), and Dong Nai (10.01%).

The primary engines behind this double-digit expansion across multiple localities were the industry–construction and services sectors.

In Q3 2026, 30 out of 34 localities registered growth exceeding 10% in the industry and construction sector. Notably, An Giang posted an increase of 26.27%, followed by Thai Nguyen (20.34%) and Quang Ninh (18.51%). These gains were driven by newly commissioned production capacity at electronics and equipment manufacturing plants, surging demand in the electric vehicle (EV) segment, and concerted efforts to accelerate public investment disbursement. Concurrently, the services sector saw 11 provinces top the 10% growth mark in Q3, led by Quang Ninh, Da Nang, and Hai Phong, largely fueled by international cultural and tourism festivals alongside a steady rebound in domestic consumer spending.

Meanwhile, the agriculture, forestry, and fisheries sector continued to serve as an economic anchor, maintaining steady growth of 2% to 5%. However, heavy reliance on agriculture also exposed structural limitations in some areas.

Over the nine-month period, six localities fell short of expectations, recording growth rates below 8%: Can Tho, Lang Son, Dong Thap, Ca Mau, Vinh Long, and Son La.

See all blog